GDP forecast based on semantic business cycle identification - release: 2012-11-14
Special release notes
| Background | The revision of the annual national accounts data for Switzerland published by the Bundesamt für Statistik led to severe revisions of the quarterly estimates calculated by the State secretariat for economic affairs (seco). The revised quarterly accounts (see the online seco notes) have been published in September 2012 and now form the basis for our forecasting of Swiss real GDP. | ||||||||||||||||||||||||||||||||||||
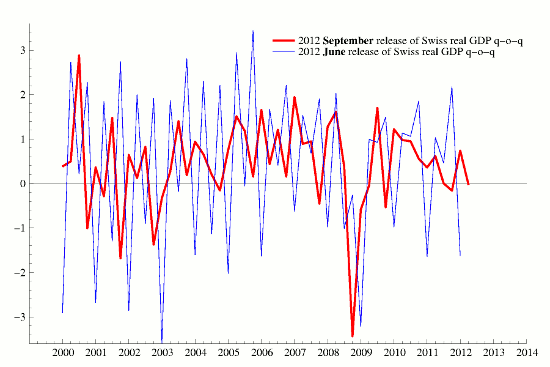
| Impact | A brief glance at the graph below sketches the importance of the latest revision. The new and the previous data on quarter-on-quarter changes (calculated as percentage changes of the level figures, not seasonally adjusted) seem to be quite different. The variance of the latest release is much smaller and so is its seasonal component. | ||||||||||||||||||||||||||||||||||||
| Illustration | Swiss quarterly GDP (not seasonally adjusted) before and after the summer 2012 revision | ||||||||||||||||||||||||||||||||||||
 |
|||||||||||||||||||||||||||||||||||||
| Challenge | In our original paper we motivated the use of the surprise index on theoretical grounds. Its apparent correlation with year-on-year growth of Swiss real GDP and the high correlation of the survey data information with the quarterly growth rate lent support to our arguments. The new pattern of real GDP changes raises the question of the appropriateness of continuing the use of the surprise indicator for estimating, or forecasting real GDP. In order to answer this question we perform again simple correlation analyses between the percentage change of quarterly Swiss real GDP and the two important input variables from the survey data. The correlation coefficients for the concurrent and leading survey data information with GDP data before and after the revision are investigated. | ||||||||||||||||||||||||||||||||||||
Analyses |
|
||||||||||||||||||||||||||||||||||||
| Effects | The table shows that the surprise indicator seems to be even more informative now for real GDP growth when compared to the situation before the revision of the GDP estimates. However, there is now also evidence for a shift of the informational advantage. The concurrent surprise indicator value is correlated with the (new) GDP growth less strongly than is its own lead. This implies that the surprise indicator can also be used as a lagging indicator. The second piece of survey data information that has so far entered our quarterly forecasting model («em») seems to be less correlated with GDP growth than it was before the revision. | ||||||||||||||||||||||||||||||||||||
| Remark | The relevance of the surprise indicator for GDP growth is communicated as a time series plot of the surprise indicator itself and year-on-year GDP growth. Therefore, the correlation of year-on-year growth of the new GDP data and the surprise indicator has also been looked at. There is virtually no difference as the new correlation coefficient of 87 per cent is pretty close to the earlier 84 per cent. | ||||||||||||||||||||||||||||||||||||
| Conclusions | While the (unfiltered) new and old releases of GDP q-o-q growth rate figures have little in common in terms of linear correlation, the surprise indicator as devised by Mueller and Koeberl (2007) seems to remain a valuable source of information. The future will tell if it will also continue to produce informative forecasts as it used to do for the GDP releases prior to the latest revision. | ||||||||||||||||||||||||||||||||||||
| «back | |||||||||||||||||||||||||||||||||||||
| «project home | |||||||||||||||||||||||||||||||||||||